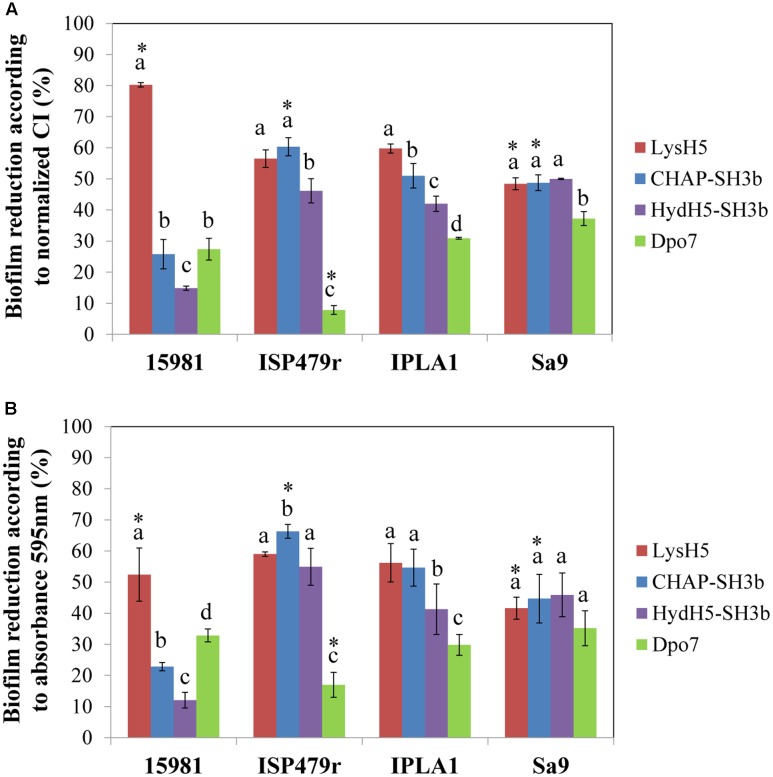
FIGURE 3.
Comparison of the RTCA-based technique and conventional crystal violet staining expressed as biofilm reduction (%) after 16 h of treatment at 37°C. Data were calculated for each biofilm-producing staphylococcal strain treated with the protein under study using the values obtained by measuring (A) the normalized CI or (B) crystal violet staining (absorbance at 595 nm). Bars represent mean ± standard deviation of three biological replicates. Bars within each strain having distinct lower case letter indicate that the protein treatment is statistically different (p < 0.05); for the each pair strain/protein, an asterisk represents statistical differences between the biofilm reduction (%) obtained using the normalized CI and the absorbance 595 nm values (p < 0.05; ANOVA and SLK post hoc comparison).

