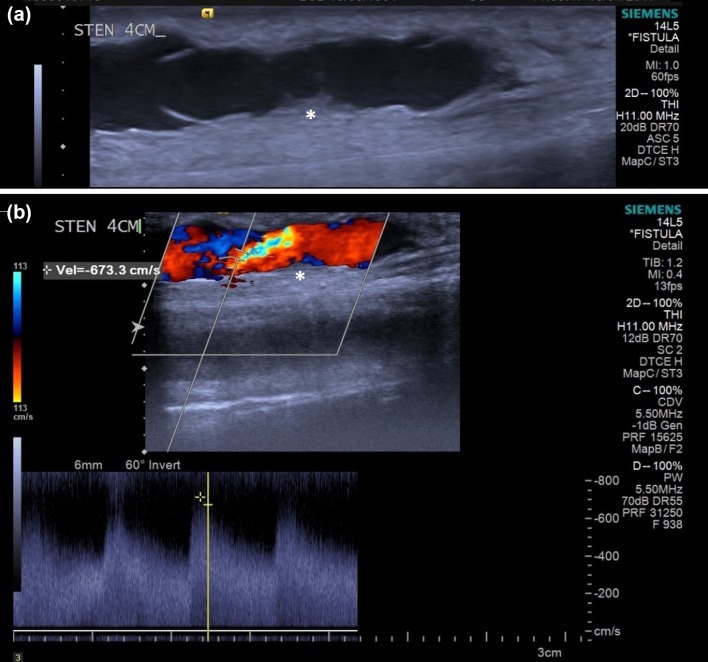
Figure 1.
(a) US b-mode image of the vein-side of an AVF with a stenosis (marked with an asterisk). Also visible are the leaflets of a venous valve fixed in position. (b) US b-mode image of the same area superimposed with the colour Doppler data, and with PSV recorded at 6.733 m/s at the location within the crosshairs (stenosis again marked with an asterisk).

