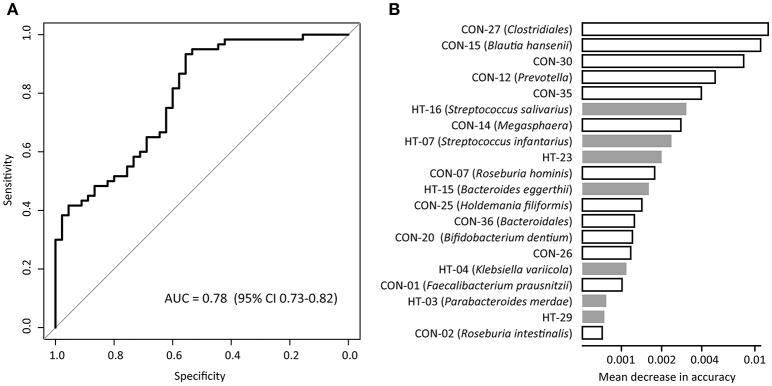
Figure 4.
Classification of hypertension status by the abundances of MLGs. (A), ROC analysis for classification of hypertensive status by MLGs, assessed by AUC. (B), The 20 most discriminant MLGs in the model classifying hypertensive patients and healthy controls. The bar lengths indicate the importance of the variable, and colors represent enrichment in patients (black) or controls (white).

