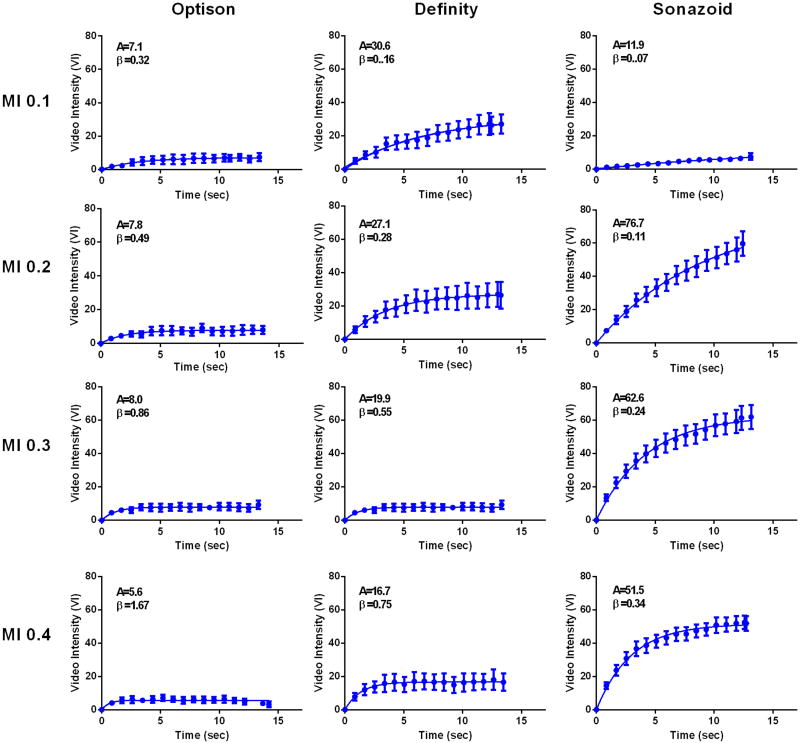
Figure 4.
Mean (±SEM) video intensity values during CEU perfusion imaging with post-destructive replenishment curves from the resting calf muscle for each agent when varying the mechanical index (MI). The A- and β-values from these curves representing averaged data from all patients are provided for each graph.

