Figure 6.
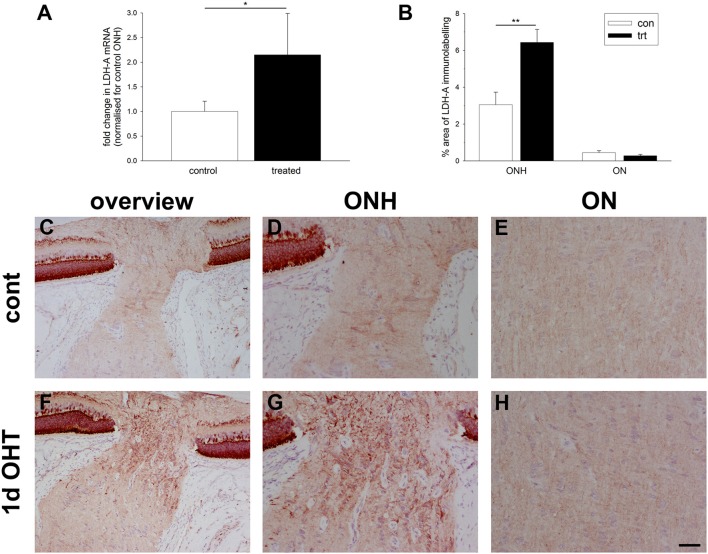
Evaluation of lactate dehydrogenase-A (LDH-A) expression in the optic nerve head (ONH) at 1 d after induction of ocular hypertension. (A) Level of LDH-A mRNA in ONH samples from OHT eyes, as measured by qPCR. Data are normalized for rhodopsin and expressed relative to controls. Values represent mean ± SEM, where n = 14. *P < 0.05, by Student's unpaired t-test. (B) Quantification of LDH-A immunolabeling in the ONH and myelinated optic nerve (ON). Values represent mean ± SEM, where n = 14. **P < 0.01, by Student's unpaired t-test. (C–H) Representative images of LDH-A immunolabeling within the ONH and proximal portion of the myelinated optic nerve (ON) of a control eye and an eye analyzed at 24 h after induction of ocular hypertension. (C,F) are low magnification images, while (D,E,G,H) show the same sections at higher magnification. In control rats, LDH-A is weakly expressed throughout retinal ganglion cell axons and by glial cells of the ONH. In treated animals, LDH-A expression is markedly upregulated within the ONH, but not ON. Scale bar: (C,F) = 100 μm; (D,E,G,H) = 50 μm.

