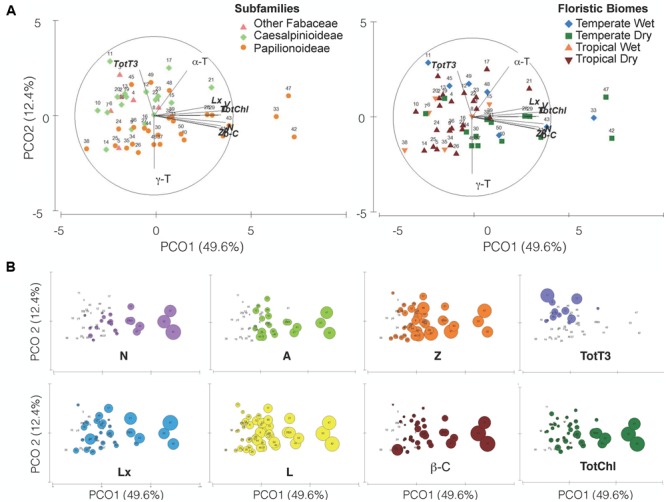
FIGURE 7.

Principal Coordinate Analysis ordination plot of the 12 variables analyzed in the 50 species studied (detailed in Table 1 and Supplementary Table S1). Variables that showed Pearson’s correlations coefficient (r > 0.5) with the PCOA axes are shown as overlay vectors. (A) Colored symbols identify subfamilies (left) or floristic biomes (right). (B) Same PCOA ordination but with superimposed bubbles representing the concentration of the eight variables (metabolites) that most contributed to the spatial ordination of the species. The size of the bubbles is proportional to the concentration of the metabolite within each panel.
