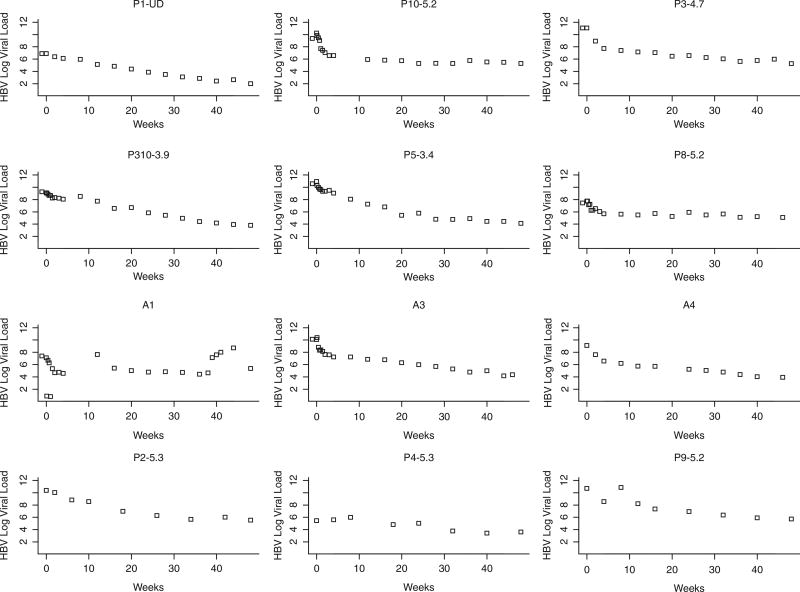
Figure 2.
Graphs of the 12 HBV+/HIV+ individuals. Hepatitis B virus (HBV) decay represented by the slope depicts the same trends toward a more rapid/steeper slope in the first 10 to 12 weeks. Subjects 10, 12, 15, and 18 portray similar trends with very linear slope. Subject 2 shows a more erratic trend. The numbers above each graph represent the number at randomization.

