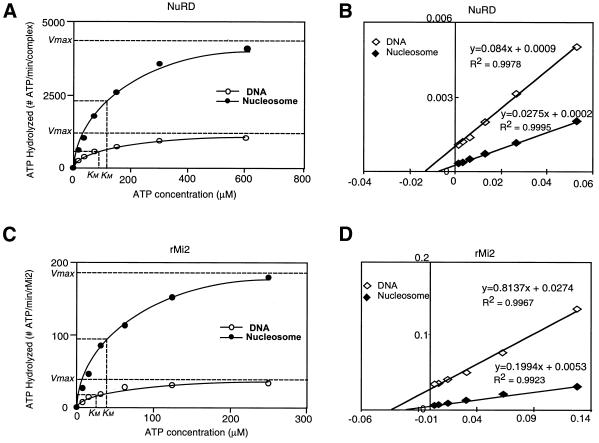
Figure 2.
Kinetic analysis of the ATP hydrolysis reaction catalyzed by NuRD and rMi2. (A and C) Plots of the ATP hydrolysis velocity, number of ATP molecules hydrolyzed by each molecule of rMi2 (C) or each NuRD (A) complex in 1 min, as a function of the ATP concentration. The plot for reactions in the presence of DNA or nucleosomes is indicated. (B and D) Double-reciprocal plots for NuRD (B) and rMi2 (D) kinetic analysis. The regression equations are shown in the Figures.

