
Figure 1.
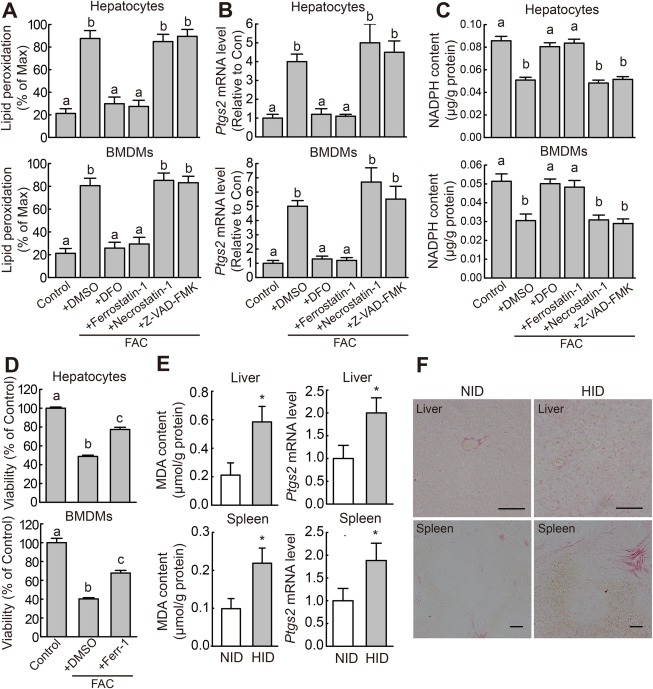
Iron overload induces ferroptosis both in vitro and in vivo. (A) Lipid peroxidation, (B) Ptgs2 mRNA level, and (C) NADPH content were measured in mouse primary hepatocytes and BMDMs treated for 12 hours with or without 100 μM FAC and the indicated specific inhibitors of cell death; lipid peroxidation was measured using C11‐BODIPY staining. (D) Cell viability was measured in mouse primary hepatocytes and BMDMs treated for 48 hours with or without 1 mM FAC and 10 μM Ferr‐1. The data in (A‐D) are representative of three independent experiments. (E) MDA content and Ptgs2 mRNA were measured in the indicated tissues of male wild‐type mice that were fed a normal diet (white bars, n = 6 mice/group) or the HID (gray bars, n = 6 mice/group) for 8 weeks after weaning. (F) Liver sections were obtained from the same animals shown in (E) and stained with sirius red; scale bars represent 100 μm. In (B) and (E), mRNA levels were normalized to β‐actin mRNA and are expressed relative to the mean value of the control cells and normal diet–fed mice, respectively. Significance in (A‐D) was calculated using a one‐way ANOVA with Tukey's post hoc test; groups labeled without a common letter were significantly different (P < 0.05). Significance in (E) and (F) was calculated using the Student t test; *P < 0.05. Abbreviations: DFO, deferoxamine; DMSO, dimethyl sulfoxide; HID, high‐iron diet; NID, normal‐iron diet.