
Figure 2.
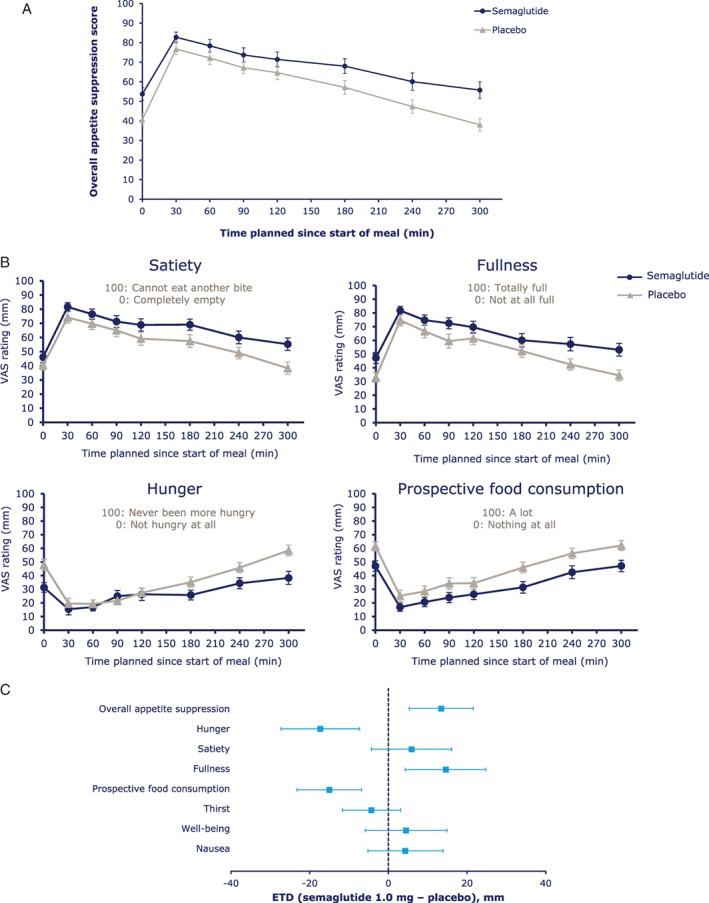
A, Overall appetite suppression score during the standardised breakfast; B, visual analogue scale (VAS) ratings of appetite during a standardised breakfast and C, fasting VAS ratings. Abbreviations: CI, confidence interval; ETD, estimated treatment difference. Overall appetite suppression score = (satiety + fullness + [100 − hunger] + [100 − prospective food consumption]) / 4. 100 indicates less appetite; 0 indicates more appetite. Error bars represent 95% CI.