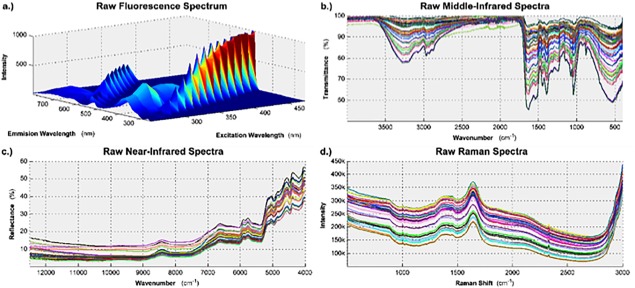
Figure 1.

The variability of the wheat hydrolysates' chemical structure was characterized using four spectral technologies.
The raw data, before any preprocessing is applied, is shown here for: (a) fluorescence spectroscopy; (b) middle infrared spectroscopy; (c) near infrared spectroscopy; and (d) Raman spectroscopy.
