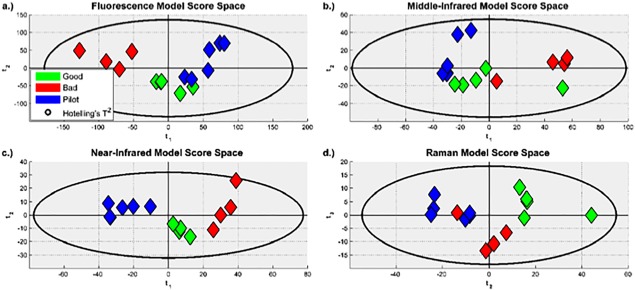
Figure 4.

Score spaces for the PCA models built from the preprocessed: (a) Fluorescence spectra. (b) MIR spectra. (c) NIR spectra. One lot is missing because of the spectra being measured at the wrong resolution. (d) Raman spectra. It can be seen that there were no outliers; and that, for all four models, the projections are similar for batches with the same classification.
The score space for the model built from NIR spectra shows the most separation between groups, followed closely by the model built from fluorescence spectra.
