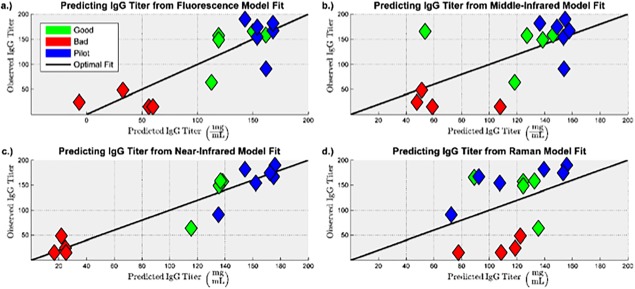
Figure 6.

Observed vs. predicted plots for predicting IgG titer for the PLS models built from the preprocessed: (a) Fluorescence spectra. (b) MIR spectra. (c) NIR spectra. (d) Raman spectra.
It can be seen that the models built from fluorescence and near infrared spectra have a lower prediction error compared to the models built from middle infrared and Raman spectra.
