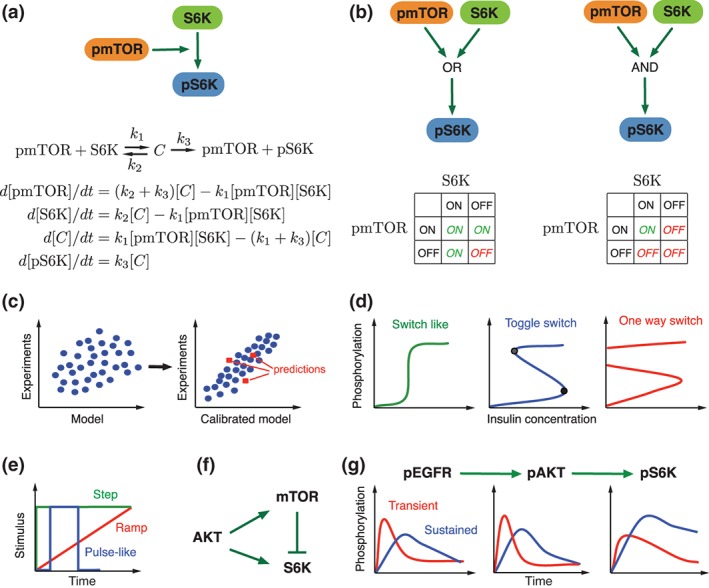
Figure 2.

Methods used in mTOR signaling network modeling. (a) Converting a network into ODEs. At the first step, the network is converted into biochemical reactions and further into a set of ODEs, assuming mass action kinetics. (b) Modeling networks using two state Boolean logic. (c) Steps required to get a useful model. Before the model calibration, there is a poor correlation between the data obtained by the model and the experimental data. The calibrated model can successfully reproduce experimental data and gives more accurate predictions than the uncalibrated model. (d) Types of bifurcation observed in biological systems. Illustrative example is given in term of sensitivity of protein phosphorylation to insulin concentrations. Drug treatment may drive the system to one of these modes. Insulin controllable modes: switch like (left) and toggle switch (middle) and uncontrollable one switch mode (right). (e) Three temporal patterns of the stimuli that have widely been used to elucidate the properties of mTOR pathway are illustrated. (f) IFFL (incoherent feed‐forward loop) has been found as an optimal mechanism to explain S6K activation by AKT.45 (g) Example of the pathway that exhibits a low‐pass filter property that could transmits slowly occurring changes in upstream regulators to downstream effectors more efficiently than fast occurring changes in upstream regulators.49
