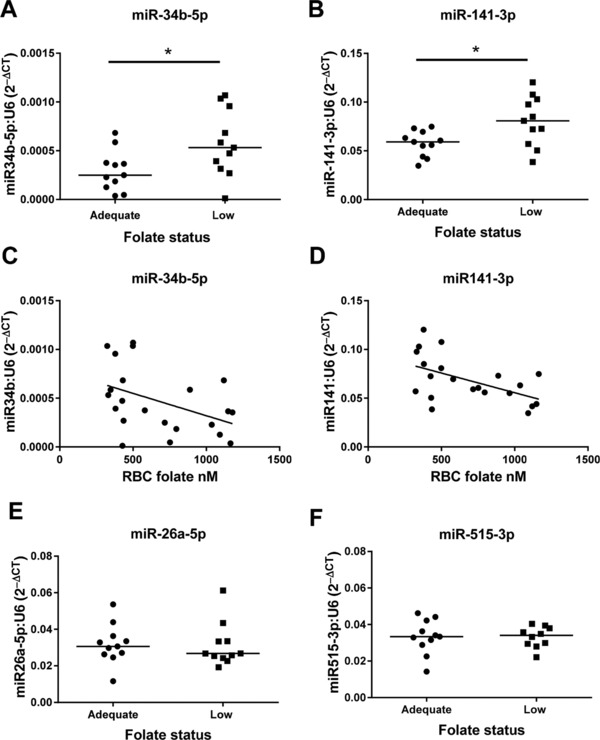
Figure 6.

Real‐time PCR validation of differentially expressed placental miRNAs between women with high and low folate status. (A) miR‐34b‐5p, (B) miR‐141‐3p, (E) miR‐26a‐5p, and (F) miR‐515‐3p, *p < 0.05 Mann–Whitney test. Correlation between maternal RBC folate and (C) miR‐34b‐5p (–0.4385, p < 0.05) and (D) miR‐141‐3p (–0.4565, p < 0.05) Spearman's correlations. Data are normalized to U6 and expressed as 2–ΔCT, n = 11/group.
