Figure 8.

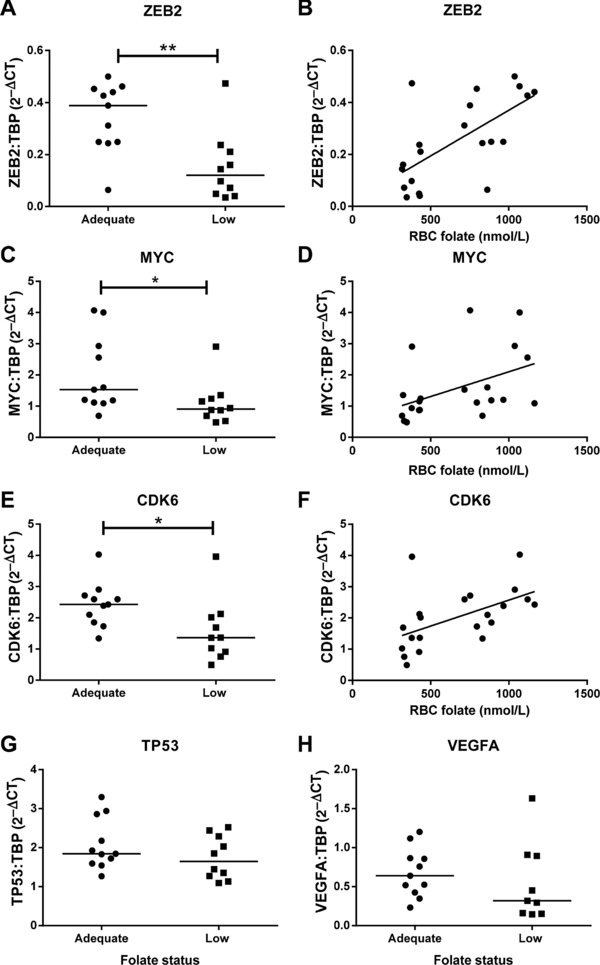
Expression of folate‐sensitive miRNA target genes in placentas of women with low compared to adequate folate status. QPCR analysis of (A) ZEB2, (C) MYC, (E) CDK6, (G) TP53, and (H) VEGFA. Data are normalized to TBP (TATA box binding protein) and expressed as 2–ΔCT. *p < 0.05, **p < 0.01 Mann–Whitney test. Relationship between maternal RBC folate concentration and (B) ZEB2 (0.6112, p < 0.01), (D) MYC (0.4961, p < 0.05), and (F) CDK6 (0.6307, p < 0.01). Spearman's correlations, n = 11 (adequate); n = 10 (low folate status).
