Figure 4.

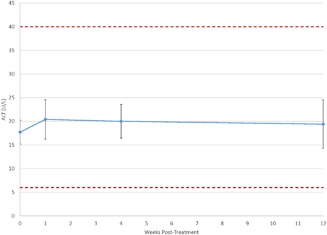
Plot of mean ALT values reveals no significant change over time. Further, mean values ± their 95% confidence interval (denoted by the error bars) remain well within the reference range (shown as dashed lines).

Plot of mean ALT values reveals no significant change over time. Further, mean values ± their 95% confidence interval (denoted by the error bars) remain well within the reference range (shown as dashed lines).