
Figure 2.
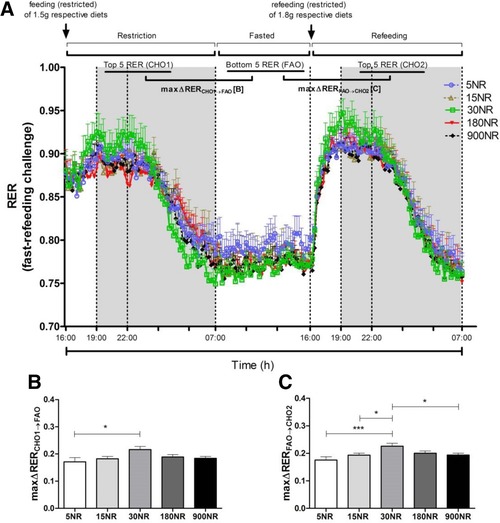
Effects of dietary NR on ΔRER during fast‐refeeding challenge at week 14. Fast‐refeeding (A): restriction (from 16:00 to 07:00 h), fasted (from 07:00 to 16:00 h), refeeding (from 16:00 to 07:00 h)periods.). 5NR open circle, 15NR open upward triangle, 30NR open square, 180NR closed downward triangle, 900NR closed diamond. Shaded areas indicate the dark, active periods. MaxΔRERCHO1→FAO (B) is difference between mean of 5 highest RER values in restriction period and mean of 5 lowest RER values in fasted period. ΔRERFAO→CHO2 (C) is difference between mean of 5 lowest RER values in fasted period and 5 highest RER values in refeeding period. The ΔRER values represent metabolic flexibility. NR in mg/kg diet. Data are analyzed using either two‐way ANOVA (A) or one‐way ANOVA followed by Dunnett's multiple comparison test, with 30NR as control (B and C), and presented as mean ± SEM (n = 11–12 mice per treatment). *p<0.05, ***p<0.005.