
Figure 6.
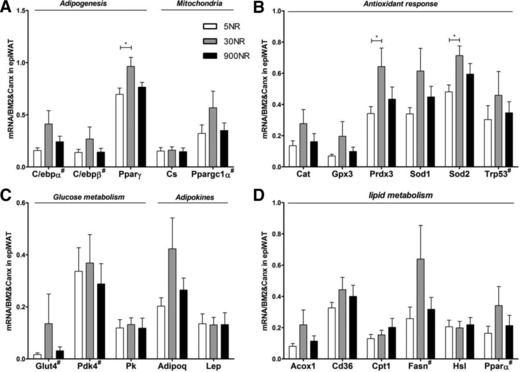
Effects of dietary NR on eWAT gene expression. mRNA levels (normalized to mean of indicated reference mRNAs) of adipogenesis and mitochondria (C/ebpα, C/ebpβ, Pparγ, Cs, Ppargc1α; A), antioxidant response (Cat, Gpx3, Sod, Sod2, Trp53; B), glucose metabolism and adipokine (Glut4, Pdk4, Pk, Adipoq, Lep; C) genes, lipid metabolism (Acox1, Cd36, Cpt1, Fasn, Hsl, Pparα; D). White 5NR, gray 30NR, black 900NR.#indicates qRT‐PCR determination was after 12‐cycle pre‐amplification. NR in mg/kg diet. Full gene names are in Supporting Information Table 2. Data are analyzed using one‐way ANOVA followed by Dunnett's multiple comparison test, with 30NR as control and presented as mean ± SEM (n = 10–11 mice per treatment). *p<0.05.