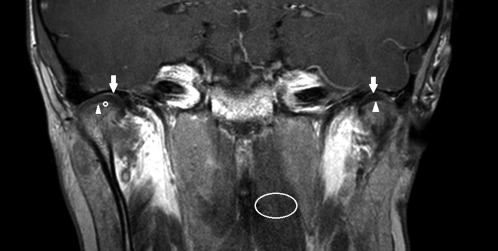
Figure 1.

T1‐weighted gadolinium‐enhanced magnetic resonance image (coronal view) of a healthy 10‐year‐old boy without temporomandibular joint (TMJ) pathology. The inferior (arrowheads) and superior (arrows) joint spaces are shown bilaterally. Regions of interest used to calculate the enhancement ratio (ER) are indicated at the right inferior TMJ space (circle) and left longus capitis muscle (ellipse). ER = 1.33 (left) and 1.21 (right).
