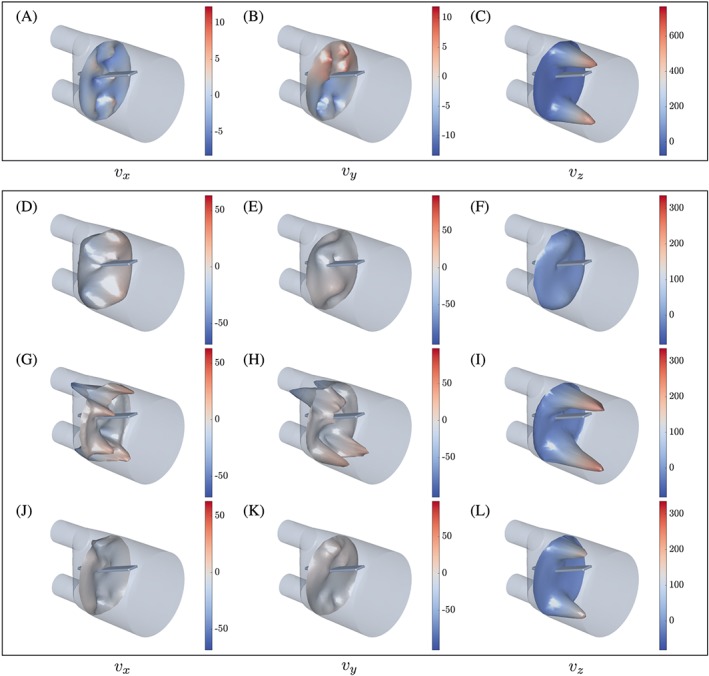
Figure 8.

Predicted flow velocity components at z = 30 mm, obtained using the inf‐sup stable scheme, rl‐3. A‐C, Phase I at t = 200 s. Phase II at D‐F, t = 0.72 s; G‐I, t = 1.20 s; J‐L, t = 2.64 s. Flow patterns exhibit significant similarities with those observed in the experiment (see the study of Hessenthaler et al37)
