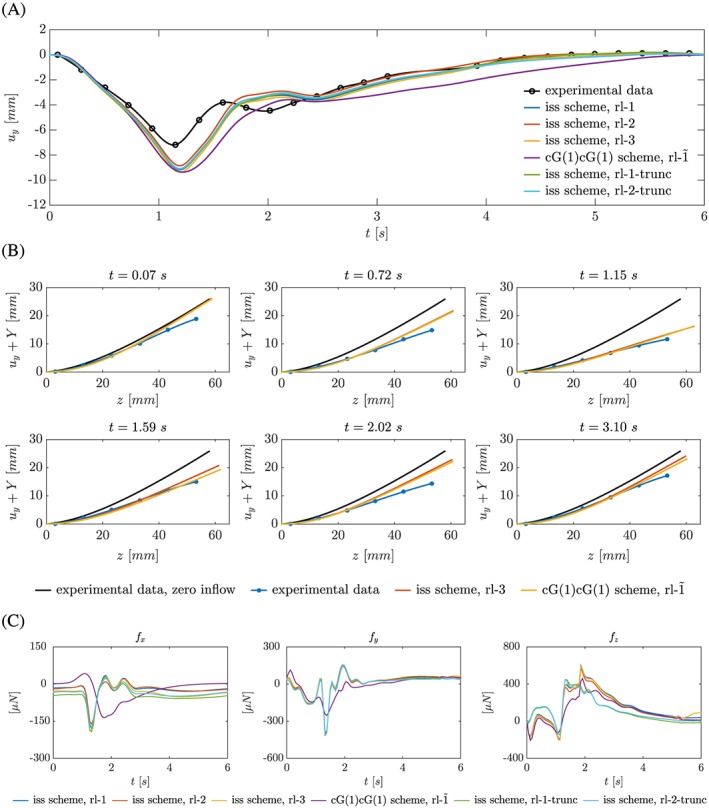
Figure 9.

Phase II: A, Graph depicts the recorded relative displacement and predicted relative displacement (cycle 10) of the silicone filament at x = 0 mm, z ≈ 53 mm for all refinement levels and both schemes. The experimental data were approximated using spline interpolation. B, Graph shows snapshots of recorded position and predicted position (cycle 10, inf‐sup stable scheme, rl‐3) of the centerline of the solid at x = 0 mm (graph from the study of Hessenthaler et al37 modified). C, Forces f exerted onto the solid during cycle 10 computed from the Lagrange multiplier variable (Equation (16))
