
Figure 12.
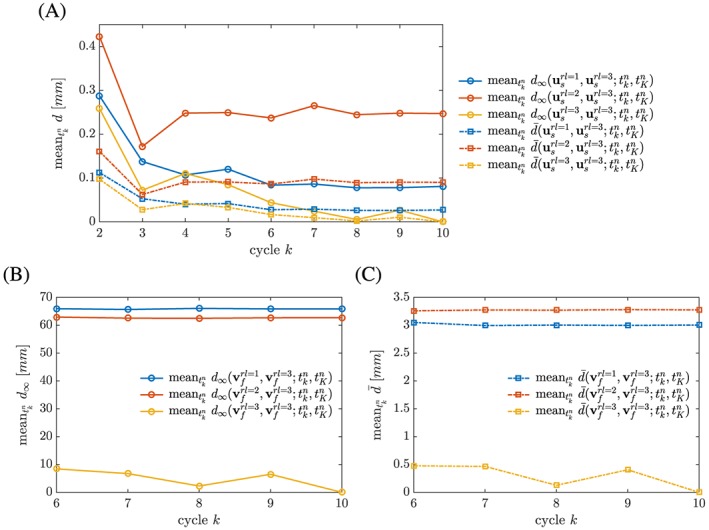
Phase II: The graph quantifies how quickly a periodic steady‐state is obtained for the displacement and flow field, u s and v f, depending on the refinement level in the fluid domain. Displacement and velocity, and , at given fluid domain refinement level for an intermediate cycle k is compared with displacement and velocity, and , at rl‐3 for final cycle K = 10 using error norms given in Equations (14) and (15) and computing the mean for given cycle