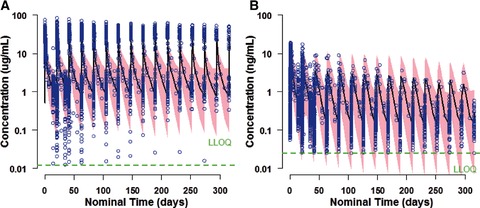
Figure 2.

Visual predictive check plots of ADC (a) and MMAE (b) for brentuximab vedotin administered intravenously at 1.8 mg/kg every 3 weeks (studies 1, 3, and 4). Pink area, 90%CI of model prediction; blue dots, observed data; green dotted line, lower limit of assay quantification. ADC, antibody‐drug conjugate; MMAE, monomethyl auristatin E.
