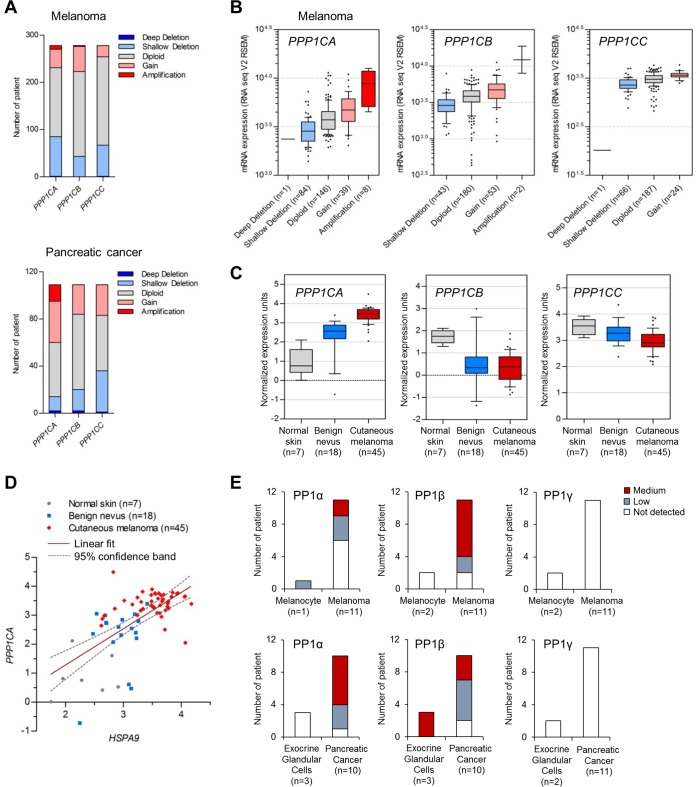
FIG 10.
Expression of protein phosphatase 1 in human melanoma and pancreatic cancer. (A) Copy number alterations of PPP1C genes encoding PP1α, PP1β, and PP1γ in melanoma and pancreatic ductal adenocarcinoma patient biopsy specimens determined by the copy number analysis algorithms defined by genomic identification of significant targets in cancer (GISTIC) (63) and RAE (64). Deep deletion and shallow deletion are caused mainly by homozygous deletion and heterozygous deletion, respectively. The skin cutaneous melanoma TCGA data set and the pancreatic cancer UTSW data set, originally generated by The Cancer Genome Atlas (TCGA) Research Network (http://cancergenome.nih.gov/) and by Erik Knudsen and coworkers (65), respectively, were obtained from the cBioPortal for Cancer Genomics database (http://www.cBioportal.org). (B) RNA-seq analysis of the melanoma biopsy specimens in panel A. The boxes, whiskers, and asterisks indicate the interquartile range (25 to 75%), the 10 to 90% range, and the minimums, maximums, and outliers, respectively. Fold changes between amplification and diploid were 2.05 (P, <0.0001; t, 6.642) for PPP1CA and 3.41 (P, <0.0001; t, 9.012) for PPP1CB (two-tailed Mann-Whitney test). Fold changes between gain and diploid were 1.222 (P, 0.0043; t, 2.889) for PPP1CA, 1.241 (P, <0.0001; t, 4.016) for PPP1CB, and 1.236 (P, 0.0005; t, 3.542) for PPP1CC (two-tailed Mann-Whitney test). Fold changes between shallow deletion and diploid were 0.732 (P, <0.0001; t, 5.44) for PPP1CA, 0.763 (P, <0.0001; t, 4.111) for PPP1CB, and 0.804 (P, <0.0001; t, 5.353) for PPP1CC (two-tailed Mann-Whitney test). The P value for PPP1CA (amplification, gain, and shallow deletion versus diploid) was <0.05 (with q = 7.344, 3.134, and 4.961, respectively) (one-way ANOVA with Dunnett's multiple-comparison test). (C) Microarray analysis of PPP1C mRNA levels in patient biopsy specimens. Data are from the Talantov melanoma data set from the Oncomine database (www.oncomine.org). Fold changes between benign nevus versus normal skin were 2.517 (P, 0.0052; t, 3.087) for PPP1CA, 0.275 (P, 0.0066; t, 3.002) for PPP1CB, and 0.926 (P, 0.1645; t, 1.436) for PPP1CC (two-tailed t test). Fold changes between cutaneous melanoma versus normal skin were 3.799 (P, <0.0001; t, 13.38) for PPP1CA, 0.19 (P, <0.0001; t, 5.59) for PPP1CB, and 0.832 (P, 0.0006; t, 3.657) for PPP1CC (two-tailed t test). (D) Pearson correlation coefficient analysis of the HSPA9 (encoding mortalin) and PPP1CA mRNA levels in panel C (P < 0.0001; r = 0.6413). (E) Immunohistochemistry of PP1α, PP1β, and PP1γ expression in patient biopsy specimens. Data were obtained from the Human Protein Atlas database (66). PP1α was stained by antibody HPA046833 (www.proteinatlas.org/ENSG00000172531-PPP1CA/cancer), PP1β was stained by HPA065425 (www.proteinatlas.org/ENSG00000213639-PPP1CB/cancer), and PP1γ was stained by HPA013661 (www.proteinatlas.org/ENSG00000186298-PPP1CC/cancer).

