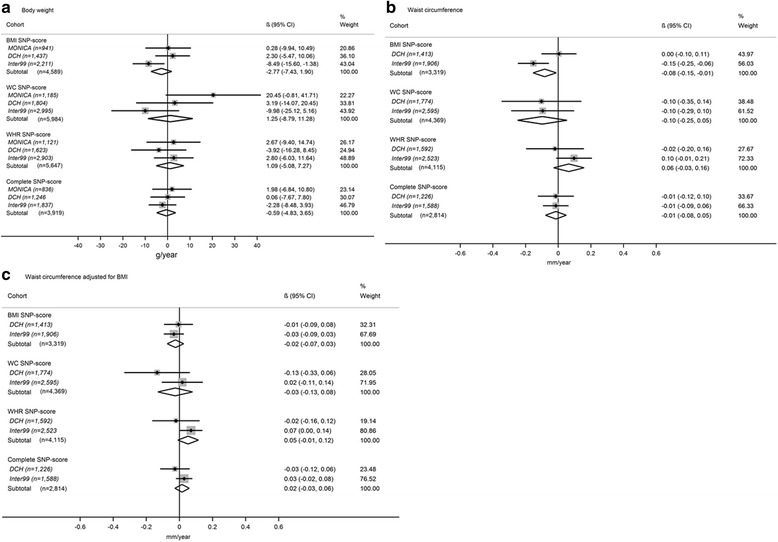
Fig. 2.

SNP score × alcohol interactions in relation to annual change in BW, WC and WCBMI. 1 Results presented in g/year and mm/year, respectively, and relate to the interaction (effect-modification) effects per additional risk allele for each alcohol unit/day. Model adjusted for baseline measure of outcome age, gender, height, smoking status, education, physical activity, menopausal status and total energy intake. 1Furthermore, case C is also adjusted for baseline BMI
