Fig. 2.

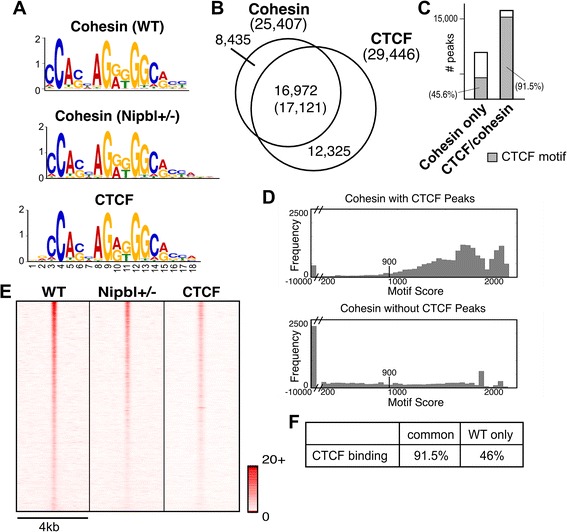
Most of cohesin-binding sites contain CTCF motifs. a De novo motif search of cohesin-binding sites using MEME. The CTCF motifs identified at the cohesin-binding sites in WT and mutant MEFs are compared to the CTCF motif obtained from CTCF ChIP-seq data in MEFs (GSE22562) [40]. E values are 5.5e−1528 (cohesin-binding sites in WT MEFs), 6.6e−1493 (cohesin-binding sites in Nipbl MEFs), and 2.6e−1946 (CTCF-binding sites in MEFs), respectively. b Overlap of cohesin binding sites with CTCF binding sites. The number in the parenthesis in overlapping regions between cohesin and CTCF binding represents the number of CTCF-binding peaks. c Presence of CTCF motifs in cohesin only and cohesin/CTCF-binding sites. Shaded area represents binding sites containing CTCF motifs defined in a (FDR 4.7%). d The CTCF motif score distribution for all cohesin peaks that overlap with a CTCF peak (top) and that do not overlap with a CTCF peak (bottom). Note that the X axis is discontinuous and scores less than 200 are placed in the single bin in each figure. For peaks that contained multiple CTCF motifs, we report the maximum score for the peak. The score threshold (900 with FDR 4.7%) is marked in each figure. e Heatmap comparison of cohesin ChIP-seq tags in WT MEFs and Nipbl mutant MEFs with CTCF ChIP-seq tags at the corresponding regions in wild type MEFs [40] as indicated at the top. The normalized (reads per million total reads) tag densities in a 4-kb window (± 2 kb around the center of all the cohesin peaks) are plotted, with peaks sorted by the number of cohesin tags (highest at the top) in WT MEFs. Tag density scale from 0 to 20 is shown. f Percentages of CTCF binding in cohesin-binding sites common or unique to WT MEFs
