
Figure 1.
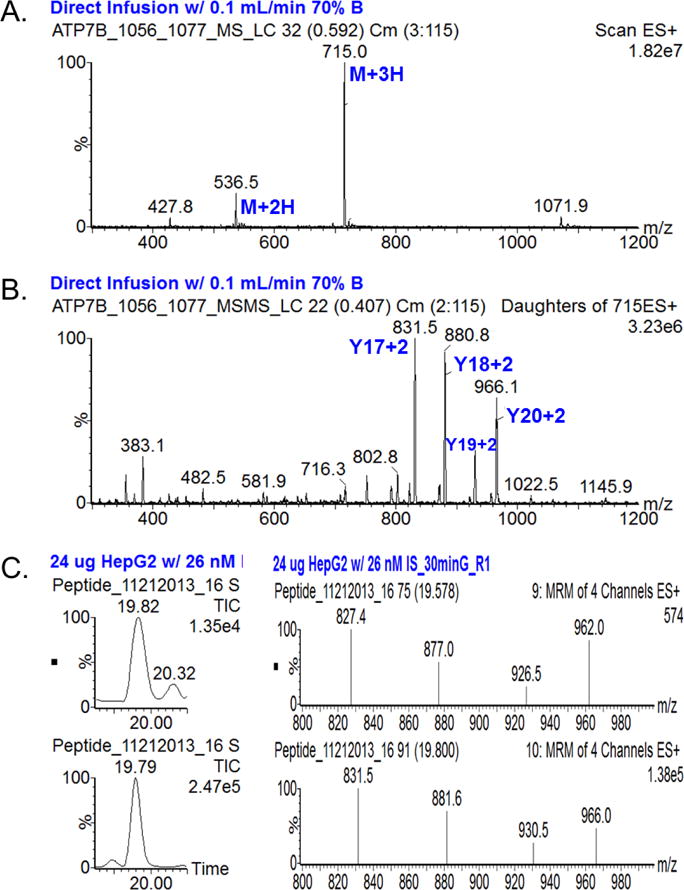
A, Mass Spectrum of heavy peptide 1056 for ATP7B and B, Tandem mass spectrum of the most abundant parent ion (M+3H). Abundant fragments are selected and optimized for SRM analysis. C, Total ion chromatogram (TIC) and SRM spectra of endogenous (top) and heavy (bottom) peptide 1056 observed in HepG2 cell extract. Chromatographic peaks overlap and SRM patterns are compatible.