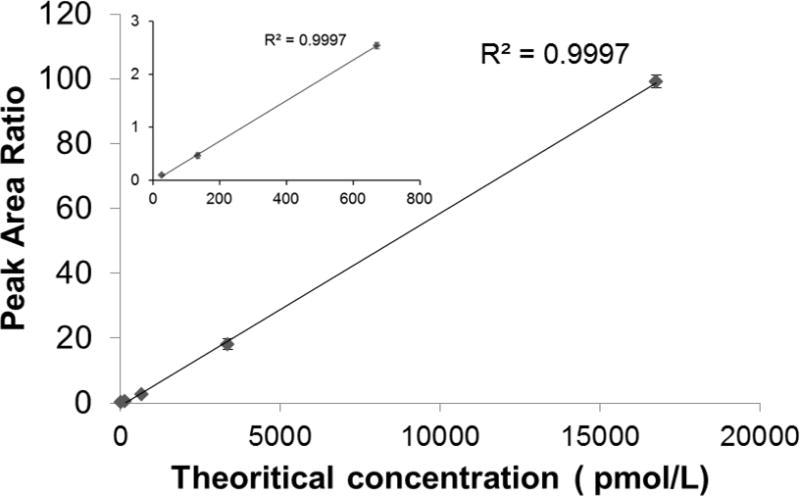
Figure 3. Response curve for ATP7B 1056 peptide.

Curves are plotted for the sum of all transitions. The inset plot shows more detail of lower end of the concentration range. Error bars are the standard deviation of three process replicates.

Curves are plotted for the sum of all transitions. The inset plot shows more detail of lower end of the concentration range. Error bars are the standard deviation of three process replicates.