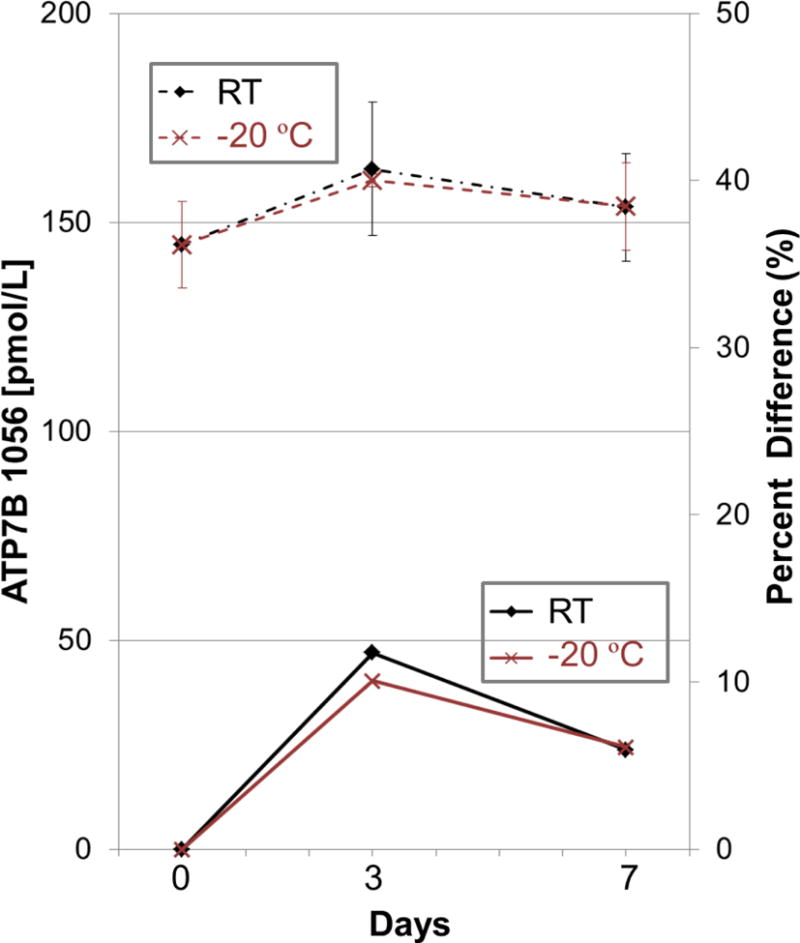
Figure 4. Stability of ATP7B 1056 peptide in normal control DBS at room temperature and −20°C for 0, 3, and 7 days.

The data represent the average of three replicates. Dashed and solid lines represent ATP7B concentrations and percent difference, respectively. Error bars are the standard deviation of three process replicates.
