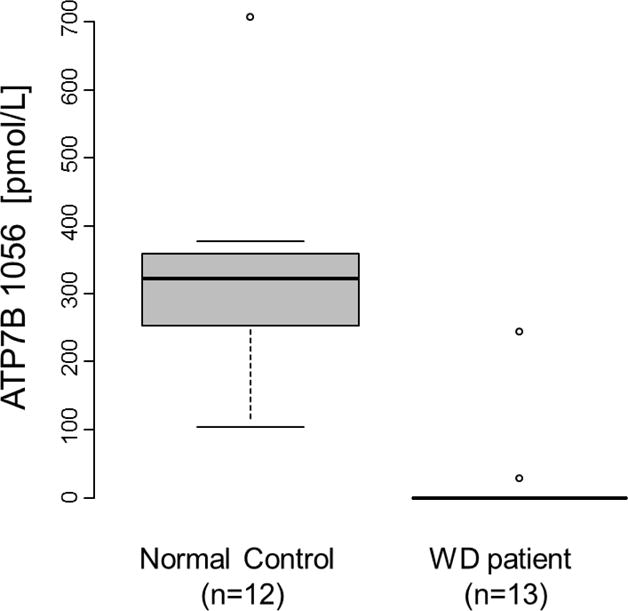
Figure 6. Distribution of the levels of ATP7B in DBS from 13 WD patients and 12 normal controls.

The bold black line indicates the median, the inner quartiles are represented by boxes, and the whiskers show 95% of the data.

The bold black line indicates the median, the inner quartiles are represented by boxes, and the whiskers show 95% of the data.