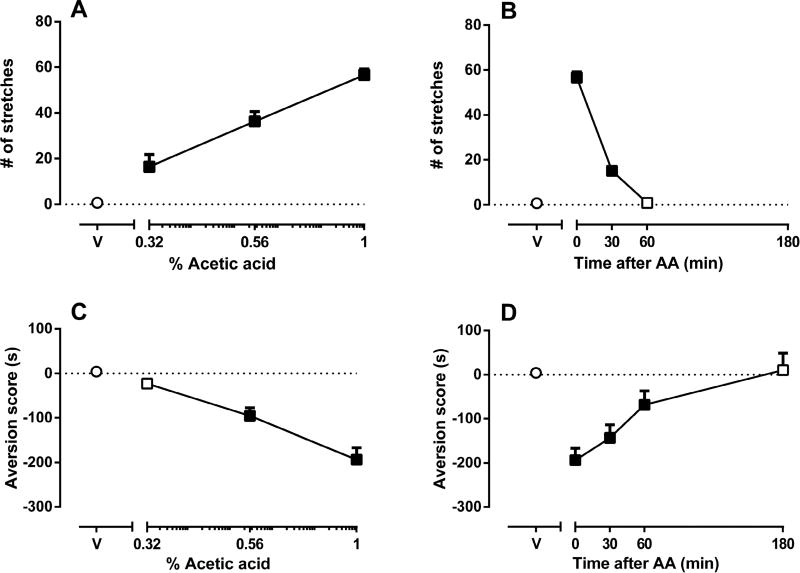
Figure 1. Effects of acetic acid (AA) concentration and treatment interval on acid-stimulated stretching and acid-induced conditioned place aversion (CPA) in mice.
Figure 1A shows the concentration-effect curve for intraperitoneal acetic acid (AA)-stimulated stretching, with AA concentration (log scale) on the x-axis and the number of stretches on the y-axis. Figure 1B shows the time course of 1% AA-stimulated stretching, with treatment time in min between AA injection and initiation of the observation period on the x-axis and the number of stretches on the y-axis. Figure 1C shows the concentration-effect curve for intraperitoneal AA-induced CPA with AA concentration (log scale) on the x-axis and the aversion score (in sec) on the y-axis. Figure 1D shows the time course of AA-induced CPA, with the treatment time in min between AA injection and initiation of the treatment conditioning session on the x-axis and the aversion score (in sec) on the y-axis. Data points above “V” represent effects of sterile water (vehicle of AA) control treatment on stretching (A,B) or aversion score (C,D), and filled symbols indicate significantly different from water as determined by one-way ANOVA followed by Tukey’s post hoc test (p<0.05). Data are expressed as means ± S.E.M. from 6–10 mice.

