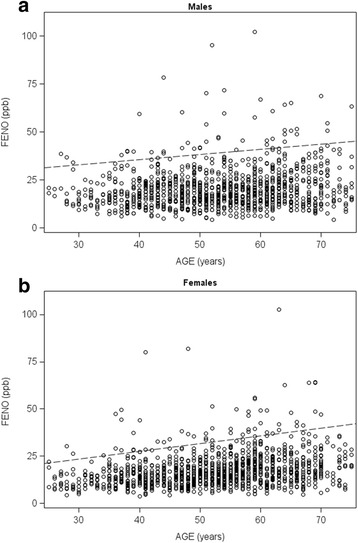
Fig. 1.

Plots of FENO against age for men (Fig. 1a) and women (Fig. 1b), respectively, which illustrate the age dependency of the upper limit normal. Only subjects with negative Phadiatop® results are presented (n = 2210). The y-axis range is restricted and excludes one female subject and three male subjects with FENO above 110 ppm. The dashed lines indicate the upper 95th percentiles assuming height of women and men to be 166 and 179 cm respectively
