
Figure 7.
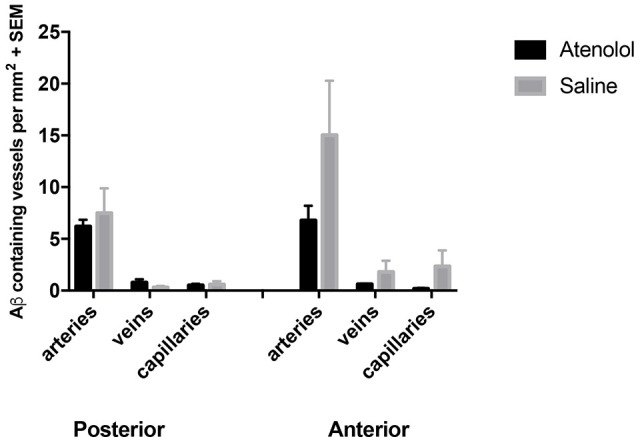
Graphs showing the number of arteries, veins and capillaries with Aβ in their walls in atenolol treated mice compared to control mice. SEM: standard error of mean.
Official websites use .gov
A
.gov website belongs to an official
government organization in the United States.
Secure .gov websites use HTTPS
A lock (
) or https:// means you've safely
connected to the .gov website. Share sensitive
information only on official, secure websites.
Graphs showing the number of arteries, veins and capillaries with Aβ in their walls in atenolol treated mice compared to control mice. SEM: standard error of mean.