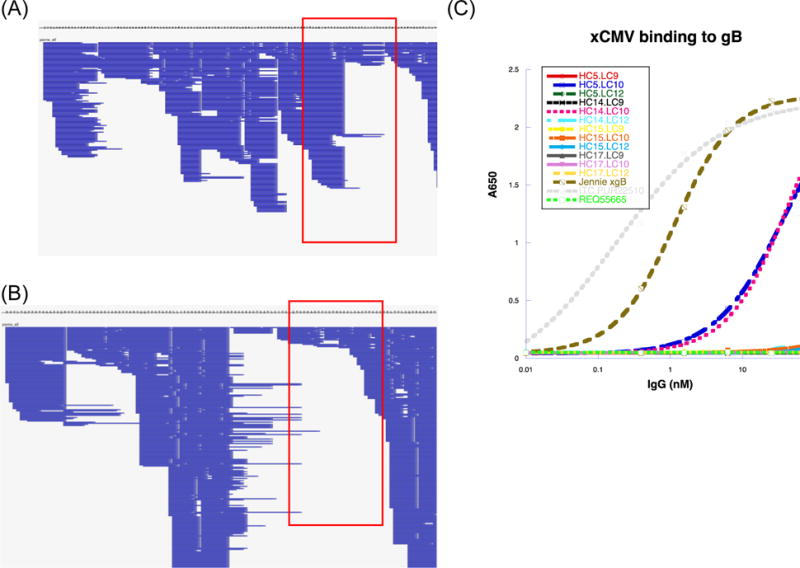
Figure 4.

Complete MS/MS coverage of the heavy chain (A) and light chain (B) variable regions. The LC matches the most abundant intact molecular weight of 22644 Da and the HC matches the most abundant intact molecular weight of 49971 Da (Figure 2). Panels show a zoomed-out view of coverage from the N-terminus to the C-terminus of the variable regions. Each horizontal blue line denotes a spectrum matched by MSGFDB database search against all de novo sequences. Areas boxed in red denote coverage of the CDR3 domain. (C) ELISA binding assay for expressed mAbs (different combinations of de novo LC and HC sequences) against the same CMV gB antigen used to purify pAbs from donor plasma. The grey dotted line is a positive control murine mAb against gB; the brown dashed line is anti-CMV pAb material from the donor; the blue dashed line indicating positive binding is a MS-derived mAb with the same variable region shown on the right (POS1); and the pink dotted line indicating positive binding refers to POS2, a mAb similar to POS1 with the same light chain but mutations in HC CDR2. The bright green dotted line is a negative control mAb. Remaining lines indicating negative binding correspond to other mAbs manufactured from de novo sequences.
