Figure 4.

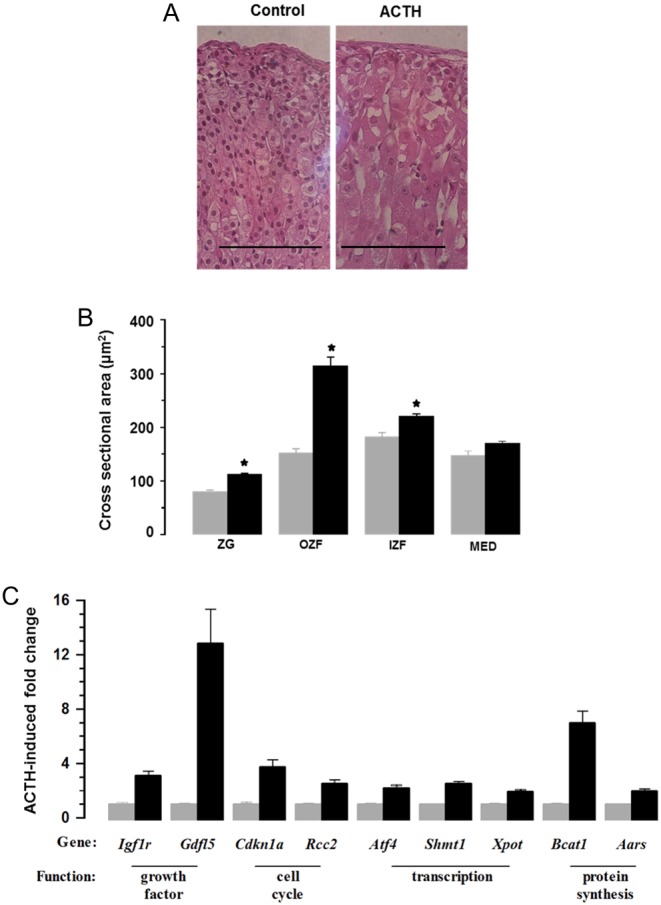
ACTH infusion caused adrenocortical cell hypertrophy (A and B) and increased expression of transcripts associated with cell growth (C). (A) Shows representative H&E-stained sections with bar indicating magnification (100 µm). (B) Shows cross-sectional area of cells in zona glomerulosa (ZG), outer zona fasciculata (OZF), inner zona fasciculata (IZF) and medulla (MED) regions of the gland. Values are means ± s.e.m. of n = 6 (control) and 6 (ACTH) adrenal glands. (C) Shows increased expression of genes associated with cell size.

 This work is licensed under a