
Figure 2.
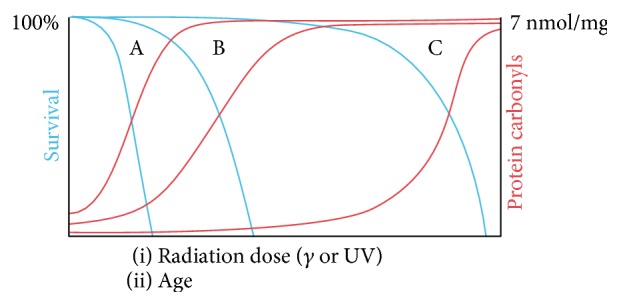
Schematic relationship between survival and protein carbonylation for different species (A, B, and C) as a function of radiation dose or age. Blue lines depict survival. Red lines depict protein carbonyl levels. Reproduced with permission from Radman [127].