Figure 1.

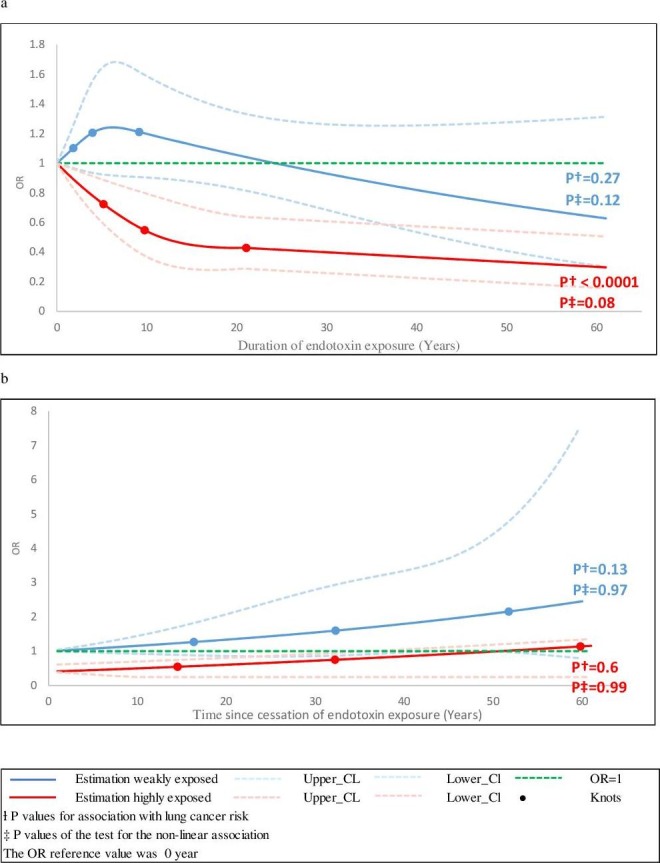
(A) Spline graphs showing the association between lung cancer risk and duration of exposure to endotoxins; (B) Spline graphs showing the association between lung cancer risk and time since cessation of exposure to endotoxins.

(A) Spline graphs showing the association between lung cancer risk and duration of exposure to endotoxins; (B) Spline graphs showing the association between lung cancer risk and time since cessation of exposure to endotoxins.