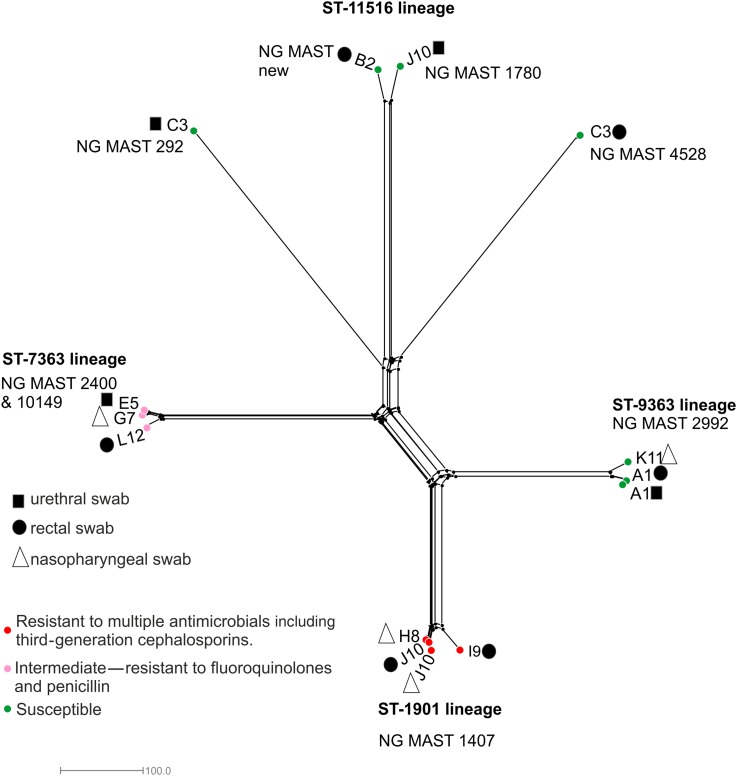
Figure 2.
Neisseria gonorrhoeae genome comparison. NeighborNet tree depicting N. gonorrhoeae isolates compared using the 1668 loci core to the gonococcal genome (N. gonorrhoeae cgMLST V.1.0). Black squares depict isolates obtained from urethral samples; black circles isolates retrieved from rectal swabs with triangles indicating nasopharyngeal isolates. Red circles depict gonococci resistant to multiple antimicrobial compounds including third-generation cephalosporins and fluoroquinolones; pink circles indicate gonococci resistant to fluoroquinolones and penicillin, while green circles depict antimicrobial susceptible gonococci.

