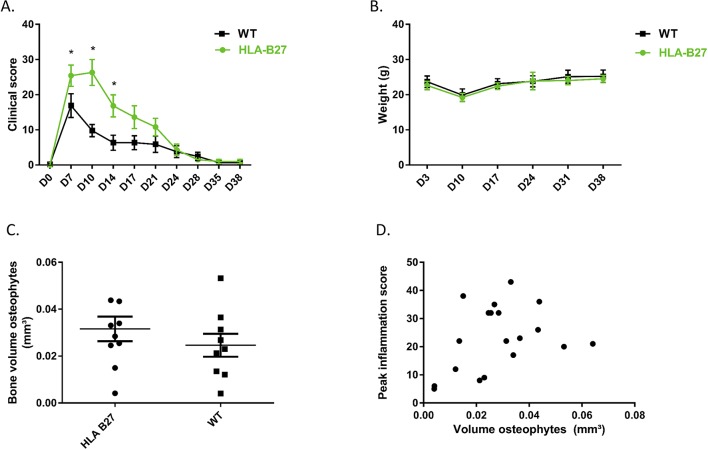
Figure 6.
CAIA model in HLA-B27 transgenic versus WT C57BL/6 mice. (A) Clinical score of mice at different time points. Data points are shown as average and SEM. Statistical analysis was performed by two-way ANOVA, Sidak post hoc. p<0.05 was considered as statistically significant. (B) Weight of mice at different time points. Data points are shown as average and SEM. (C) Measurement of osteophyte volume at the navicular bone of the left and right hind paw at 6 weeks after disease induction. Data points are the sum of the volume of the osteophytes at the left and at the right paw from the same mouse. Data points are shown as average and SEM. Statistical analysis was performed by unpaired t-test. p<0.05 was considered as statistically significant. (D) Correlation between peak inflammation score and osteophyte volume (sum of left and right paw).

