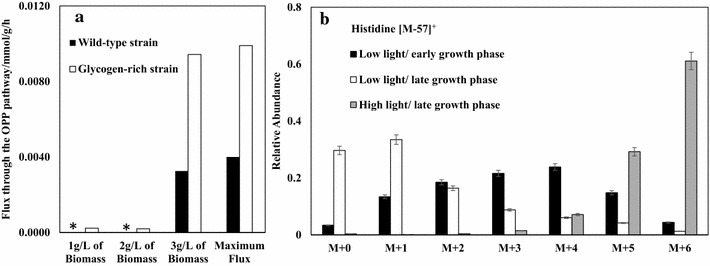
Fig. 4.

The oxidative pentose phosphate (OPP) pathway in cyanobacteria. a Comparison of simulated fluxes through the OPP pathway between wild-type (black bars) and glycogen-rich (white bars) cyanobacteria strains at different biomass concentrations. ‘Asterisk’ means the flux is zero. Compared to the wild type strain, the model assumes that the glycogen-rich strain accumulates five times more glycogen during autotrophic growth and consumes glycogen five times faster during heterotrophic growth. b Relative abundance of histidine labeling profile under different Synechocystis growth phases. Black bars (low light/early growth phase): light intensity of ~50 µE/m2/s; white bars (low light/late growth phase): light intensity of ~50 µE/m2/s; grey bars (high light/late growth phase): light intensity of ~100 µE/m2/s
