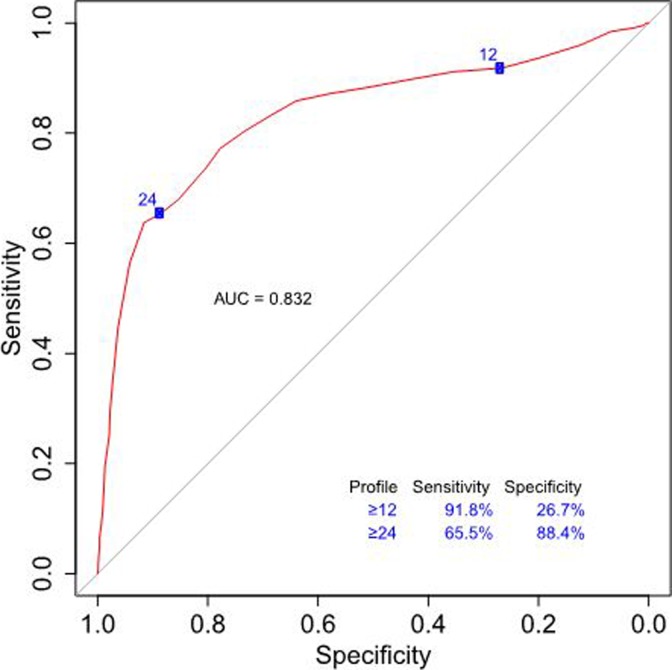
Figure 2.
The ROC curve for profile-predicted OUD diagnosis. A profile score of ≥12, which corresponds to moderate of OUD, has a sensitivity of 91.8% and specificity of 26.7%. This cutoff is used for ruling out patients unlikely to exhibit aberrant behavior with opioids. At a profile score of ≥24, which corresponds to high risk, the sensitivity decreases to 65.5% and the specificity increases to 88.4%. This cutoff is used for ruling in patients for conservative treatment protocols and more regimented monitoring while on opioids. The AUC of the ROC curve is 0.832 (95% confidence interval: 0.808-0.857), indicating the profile algorithm is able to correctly diagnose OUD >83% of the time. Sensitivities and specificities for all profile scores are shown in Supplemental Table 1. AUC indicates area under the curve; ROC, receiver operating characteristic; OUD, opioid use disorder.

