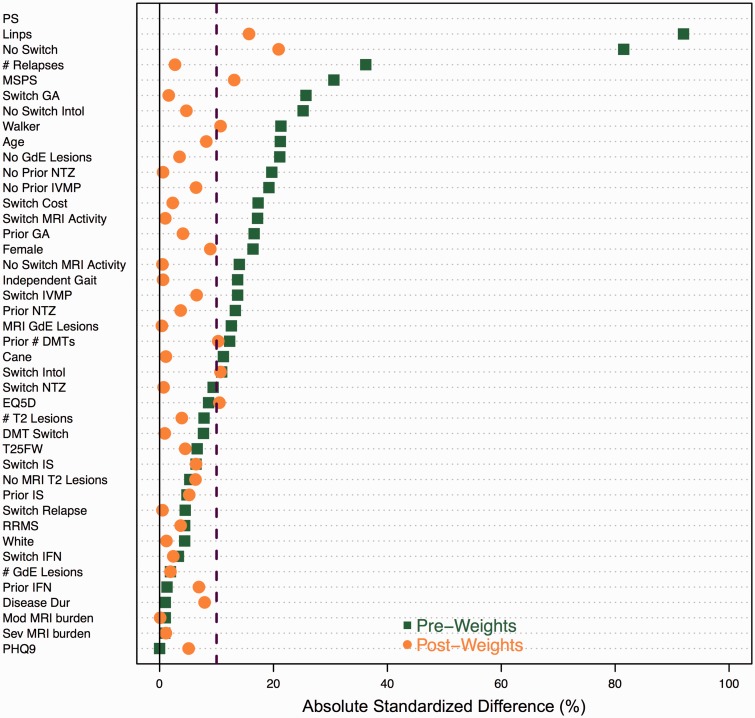
Figure 2.
Absolute standardized difference plot comparing baseline covariates between dimethyl fumarate (DMF) and fingolimod (FTY) before and after average treatment effect on the treated (ATT) weighting using the linear propensity score.
Positive values represent higher standardized effect sizes for dimethyl fumarate (DMF).
DMT: disease-modifying therapy; EQ5D: European Quality of Life-5 Dimensions; GA: glatiramer acetate; GdE: gadolinium-enhancing; IFN: interferon; intol: intolerability; IS: immunosuppressive therapy; IVMP: intravenous methylprednisolone; linps: linear propensity score; MRI: magnetic resonance imaging; MS: multiple sclerosis; MSPS: Multiple Sclerosis Performance Scale; NTZ: natalizumab; PHQ9: Patient Health Questionnaire-9; PS: propensity score; T25FW: timed 25-foot walk.

