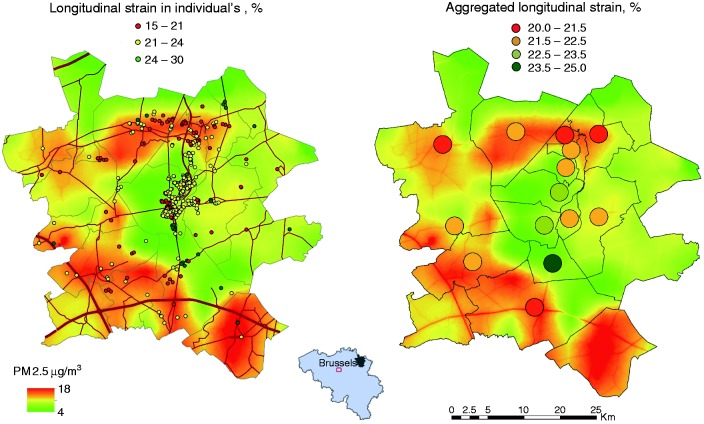
Figure 1.
Geographical association of multivariable-adjusted longitudinal LV strain at the individual level or aggregated per municipality were associated with PM2.5 air pollution contours. Grey lines indicate borders of municipalities. Red lines represent the air pollution contours of major roads. The Spearman rank correlation between longitudinal LV strain and exposure to PM2.5 was −0.13 (p = 0.0005) and −0.90 (p < 0.0001) in individual and aggregated data, respectively.
LV: left ventricular; PM: particulate matter

