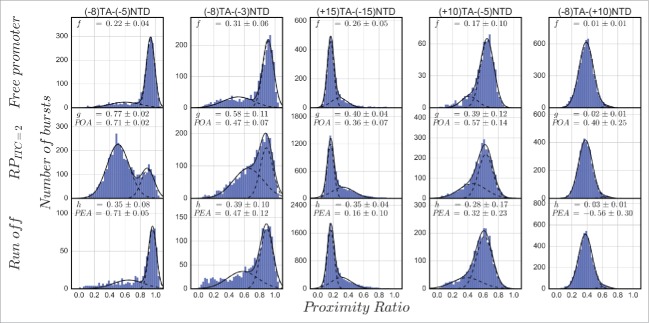
Figure 1.
Promoter bubble opening activity (POA) and promoter escape activity (PEA) of doubly labeled lacCONS promoter dsDNA. Each panel reports the proximity ratio histogram for FRET between donor (D; ATTO550 or Cy3B in the case of (+15)TA−(−15)NTD) and acceptor (A) labeling different promoter registers on either the template (T) or the nontemplate (NT) strands. From left to right, two panels report results for both dyes in the bubble region in initiation, the third panel reports results when one dye was upstream from the bubble region in initiation and the other was downstream from it, and the last two panels report results when one dye was in the bubble region in initiation, while the other downstream from it. From top to bottom, shown are proximity ratios of the free promoter DNA, in within the RPITC = 2 initiation complex and after run-off should have occurred following supply of all four NTPs. f, g and h represent the fraction of the sub-population that is not the major one in the measurement of free promoter DNA and their values are reported as a result of a constrained two Gaussian fit (see the appendix). Promoter bubble opening activity (POA) and promoter escape activity (PEA) are calculated from these fractions as described in the appendix.

