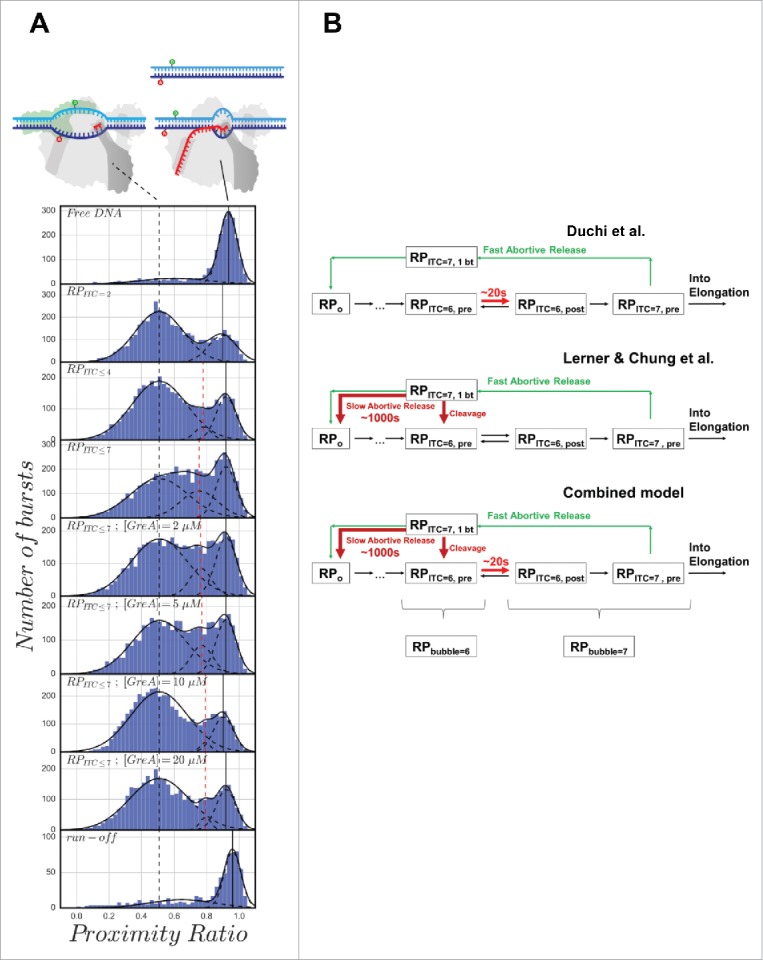
Figure 2.

(A) Proximity ratio histograms exhibit a sub-population with decreased transcription bubble size in RPITC≤ 7, which is reversible by addition of increasing amounts of GreA. Proximity ratio histograms of (−8)TA−(−5)NTD are shown. From top to bottom, histograms are shown for the conditions indicated in the labels of each panel. The solid black vertical line denotes the peak PR of a sub-population whereby the DNA between the dyes is annealed (either free promoter DNA or RNA-promoter closed complex, see vignettes). The dashed black vertical line denotes the peak proximity ratio the melted DNA in the open bubble sub-population in RPITC = 2 (see vignette). The dashed red vertical line denotes the peak proximity ratio of a sub-population that is intermediate between the sub-populations of closed and opened bubble DNA. Sample preparation, measurement and analysis performed as explained by Ingargiola et al.,59 only with triphosphate adenylyl(3′–5′) adenosine (pppApA, generously provided as a gift by Prof. Richard Ebright), instead of adenylyl(3′–5′) adenosine (ApA). Sub-population fitting analysis was performed as described in the appendix. (B) Two different paused initiation states as described by Duchi et al.1 and by Lerner, Chung et al.,2 and a model that combines both types of initiation pausing. RPITC = 6, pre and RPITC = 6, post denote RPITC = 6 with the 3′-terminal base positioned at the pre- and post-translocated sites in RNAP, respectively. RPITC = 7, pre is defined in the same way as RPITC = 6, pre, but for a 7-mer nascent transcript. RPITC = 7, 1 bt denotes an initiation complex with a 7-mer nascent transcript backtracked by one base.
