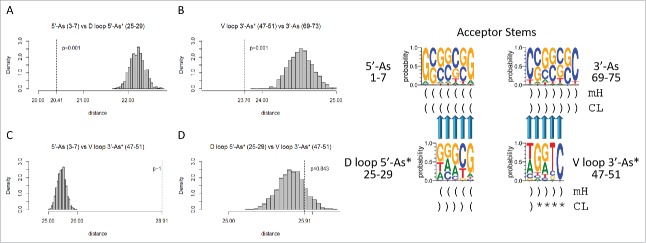
Figure 5.
Homology of acceptor stems and acceptor stem remnants. The dotted line indicates the observed alignment evolutionary distance score. The gray histogram indicates 1000 randomly permuted sequences of the same base composition. In the sequence logo, blue arrows indicate homologous positions. Parentheses indicate base pairing. Asterisks indicate loops. mH indicates minihelices or microhelices. CL indicates cloverleaf fold.

