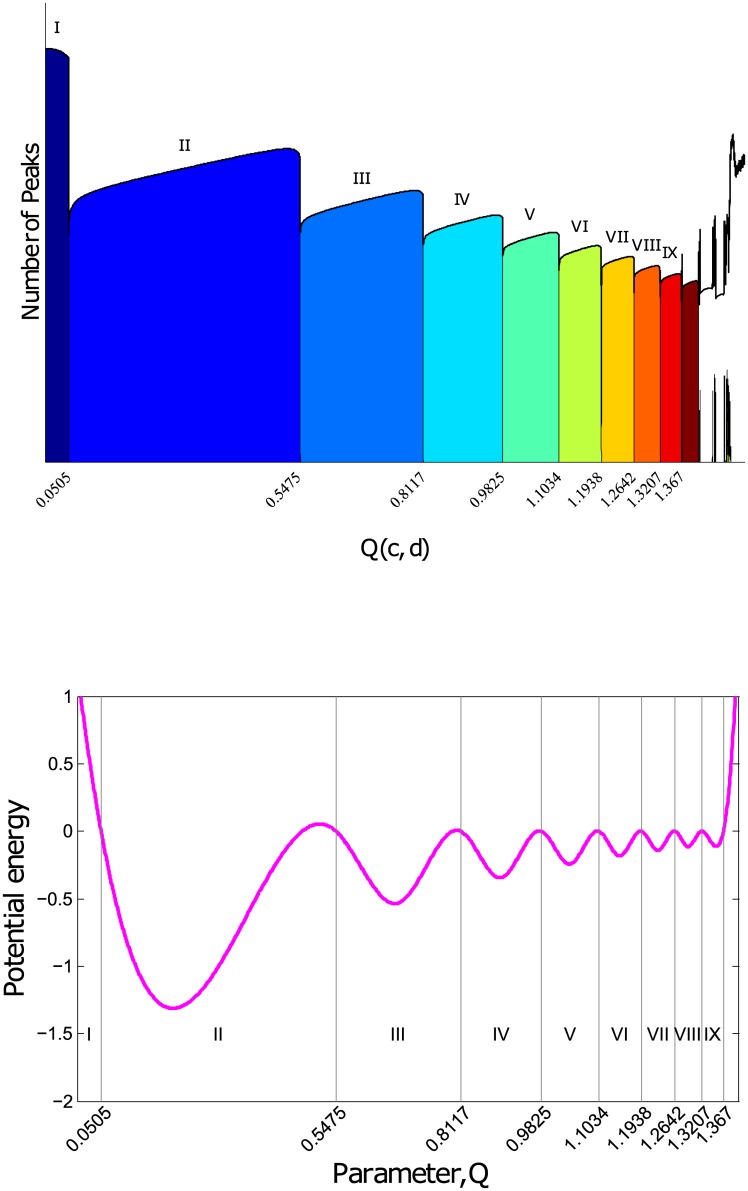
Fig 3.
Top: Boundaries of each of the various spiking regimes found by collecting long times series of each of the parameter values from Q = 0 to Q = 2 (showing only Q = 0 to Q = 1.4 because beyond this value of Q, the neuron is in the FS regime) in steps of 4 × 10⁻⁵ and using peak analysing technique to segregate and count the various peak type observed. The vertical axis represents the number of peaks per unit time, and spiking types are labelled in Roman numbering as illustrated in Fig 1. Bottom: Phase Diagram Inspired Energy Landscape obtained by performing a cubic spline of critical turning points of the boundaries and their midpoints. The absolute value of the energies is inconsequential to the dynamics, thus the energy at the boundaries is arbitrarily set to 0 while that of their midpoints is set to the difference of the parameter values at the boundary.

