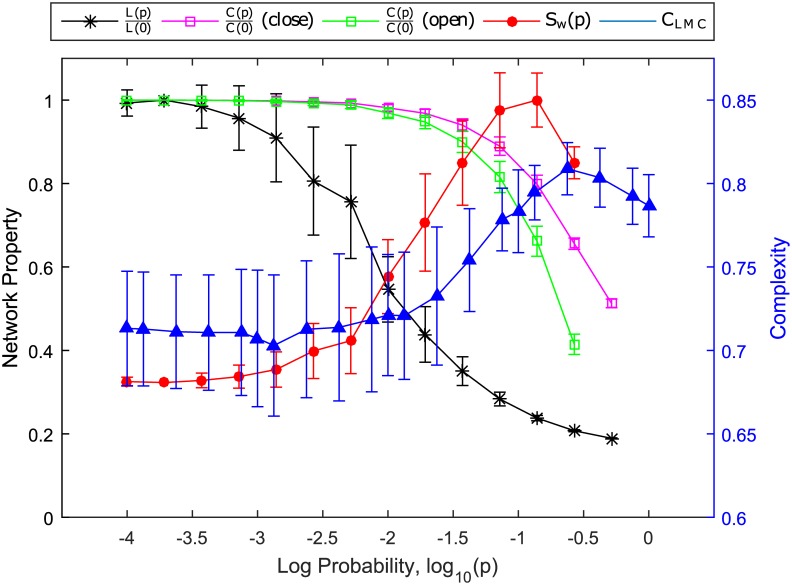
Fig 7.
Left axis: Plot of clustering coefficient C(p)/C(0) and characteristic path length L(p)/L(0) of the networks, both scaled so that their maxima are one, with varying rewiring probabilities, p. The ratio between these two properties, Sw(p) = C(p)/L(p), is indicative of the transition to a small world network. In this figure, Sw(p) is also scaled so that its maximum is one. Right axis: Plot of the statistical complexity CLMC versus the rewiring probability p, averaged over the parameter time series Q(i)(t) of the i = 1, …, 200 neurons. We do not show the clustering coefficient C(p) versus varying probability p to add a shortcut because the original k-nearest-neighbor network was not destroyed by adding shortcuts, even at very high p, and thus the resulting network is not fully random. Note: Connecting lines were added the data points only to enhance visibility of the trends.

