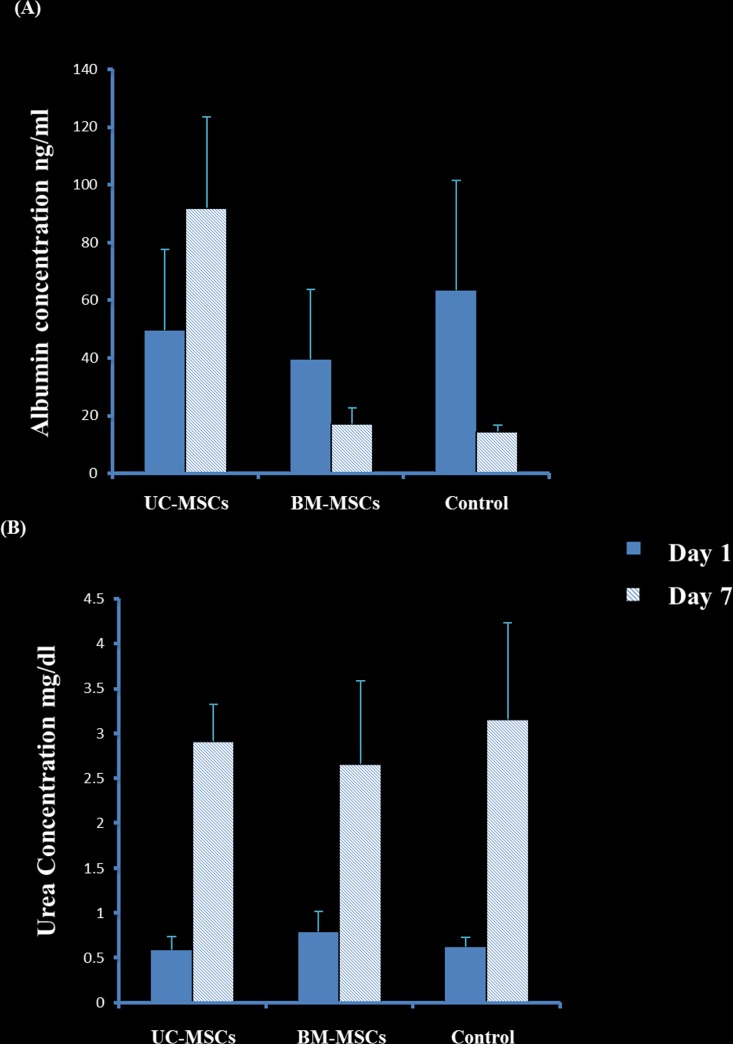
Fig 5. Urea and albumin concentration of cell culture of HepG2 and stromal cells at day 1 and day 7 day.
Where control is only HepG2 cells, whereas each stromal cells bar represents co-cultured cells of HepG2 and MSC (UC or BM). At day 7 in the culture, the secretion of albumin by the co-culture of HepG2 and UC-SCs significantly increased as compared to untreated HepG2, (P = 0.03). For urea, after 7 days all the cultured cells showed an increase in the urea level within 7 days (P<0.05). Mean± SD. Tow-way ANOVA.

